Engagements across federal regulatory, clinical trial, medical device, veterinary and industrial programs. Client names are withheld where the work remains under contract; the science, the methods and the decision at stake are described in full.
A sterilization products manufacturer had watched first-pass yield decline across three biological indicator product families. Out-of-specification results were driving retesting, investigations and delayed lot release. Historical capability analysis settled the first question quickly: the process could not consistently hold the target, and all three families carried negative performance indices against it. What leadership did not know was which sources of variability actually mattered.
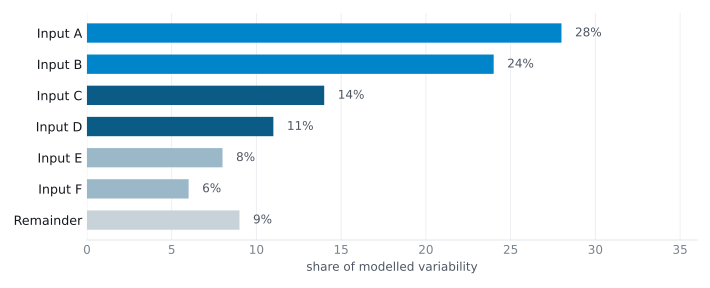
Over an eleven-week Phase 1 investigation we built the statistical case — capability analysis, process mapping, and multivariate models written to a locked statistical specification with a full audit trail. Penalized logistic regression with an exact Shapley decomposition apportioned contribution between candidate causes; variance components separated what the measurement system contributed from what the process did. Candidates were scored against a documented decision framework rather than argued in a meeting.
Most of the variability sat with a small number of contributors rather than spread thinly across the process. Material age dominated across the portfolio, and operator effect alone accounted for over half the modeled variability in one product family. The deliverable was a prioritized roadmap of characterization studies and control strategies staged behind a leadership gate — and a benefits case large enough to justify running them.
A federally funded surgical health services research program needed to know whether a policy change had shifted mortality. The data were NCHS restricted-use mortality files, handled under the access controls those files require, linked to Census population denominators and aggregated into a complete state-by-month panel covering 2009 through 2018. The analytical problem is that deaths are counts, the population producing them changes size every month, and the quantity of interest is a rate.
Modelling rates directly under a Gaussian assumption is the common shortcut and it misstates both the estimate and its uncertainty. We specified the outcome as counts in a generalized linear model with a log-population offset, which preserves the rate as the estimand while keeping the error structure honest to what the data are. Four analytical specifications were pre-registered rather than selected after the fact, and the assessment of prior trends was written as a decision rule before results were examined, so the test could fail.
That sequencing is the point. When an analysis of population health data is going to be read by people with prior commitments to the answer, the defensibility comes from what was fixed in advance, not from the sophistication of the model. The work is published as a peer-reviewed article in Annals of Surgery Open, 2026;7(3):e709, available open access.
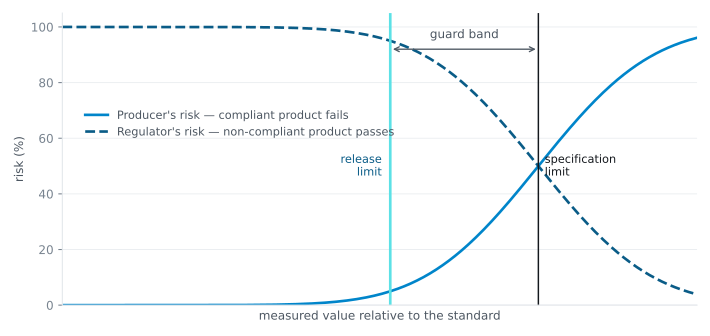
A regulator needed to know what one passing certification test established about a product's compliance with an emissions standard. Using certification and retest records, we quantified how much a product's measured emission rate varies between tests, then converted that variability into a guard band — how far below the limit a product must measure to be genuinely likely to comply.
Before any of that, the certification test itself had to be characterized as a measurement system. That was done through a nested gauge R&R rather than a crossed one, because laboratories do not test a common set of units, so laboratory and unit effects cannot be separated by a crossed design. Capability against method-specific limits was then estimated on the log scale and reported separately for a single test and for the population distribution — two different questions that a single capability index would have blurred.
The result was delivered as regulator-risk and producer-risk curves rather than a single threshold, so the agency could see the trade-off on both sides of the limit rather than accepting one number on trust.
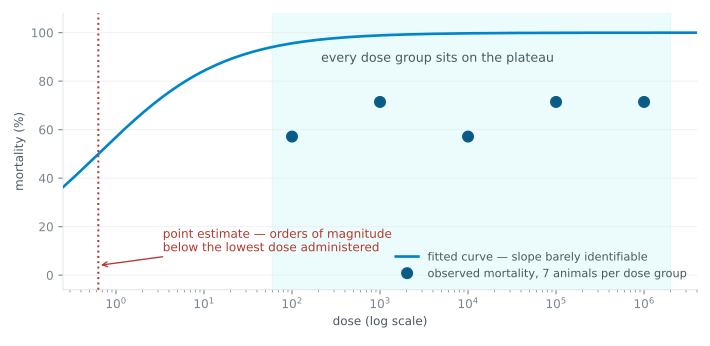
A challenge study was designed to estimate the dose lethal to half of exposed animals. Five dose groups spanned four orders of magnitude, seven animals per group, with mortality and blood counts captured for each. The statistical model converged and produced an estimate.
The estimate was not usable. Mortality ran essentially flat across every dose, which meant all doses sat on the plateau of the response curve, the slope was barely identifiable, and the confidence limits could not be computed at all. The point estimate fell orders of magnitude below the lowest dose actually administered.
The deliverable was to say so plainly: this design cannot answer this question, and the remedy is dose placement rather than a different model. Telling a sponsor what their data cannot support is often worth more than telling them what it can.
A manufacturer needed to release product lots against a potency assay, and needed to know whether shifts in the results reflected the product or the measurement system.
We analyzed 287 animals across seven groups, modeling potency against dose and dose-squared to test for curvature rather than assuming linearity, retaining non-responders as a defined class rather than discarding them, and screening for outliers before fitting. Equivalence comparisons tested each product against the reference standard directly, rather than inferring sameness from a failed test of difference.
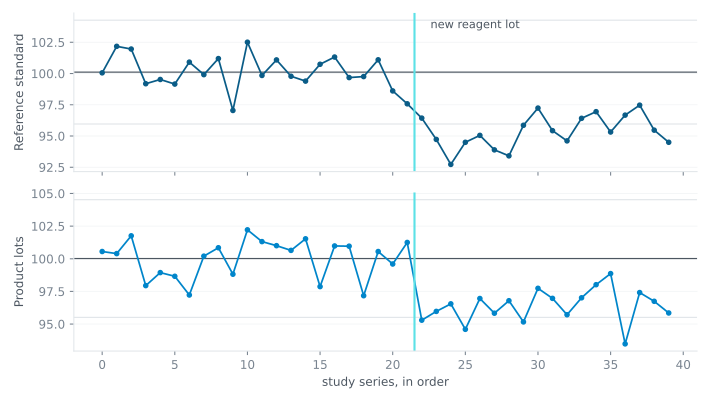
Control charting across the study series then separated drift in the assay from drift in the product — the distinction on which every release decision depended.
All federal work is subcontract, through prime contractors. MRP Group holds no prime federal awards and claims none.
Federal end clients reached this way are the Nuclear Regulatory Commission (NUREG-1507 Section 9 methodology), the Environmental Protection Agency (guard band derivation and uranium in-situ recovery monitoring design), the Department of Defense (Defense Forensic Science Center) and the Health Resources & Services Administration.
State work follows the same subcontract pattern: utilization management and provider payment analysis for the State of Connecticut, published on the Insurance Department portal with the statistical analysis plan as an appendix.
Federally funded research is a separate channel and is not federal contract past performance. Under an NIH award to a hospital research institute, the role is Co-Investigator and trial statistician on the Phase 2 whole-cell pneumococcal vaccine trial described below — authoring the statistical analysis plan across two protocol revisions, drafting the statistical response to an FDA Information Request on the active IND, and building the safety monitoring framework reviewed by an international DSMB. It is a grant role rather than a contract, and is listed here so the distinction is on the record.
Full past performance record, contract vehicle and identifiers →
Described at portfolio level rather than as individual cases. Client names on request where the work is no longer under embargo.
The recurring question across all six was whether an observed difference reflected the patient, the device, or the normative reference — which is a measurement-system question before it is a clinical one.
On its own, less than it appears. A measured value carries test-to-test variability, so a result just below a limit may reflect measurement noise rather than genuine compliance. Quantifying that variability and converting it into a guard band — how far below the limit a product must measure to be genuinely likely to comply — makes the decision defensible, and expressing it as regulator-risk and producer-risk curves shows the trade-off on both sides rather than hiding it in a single threshold.
Often, yes. Historical manufacturing and test records usually contain enough signal to establish whether a process is capable, to separate measurement-system variation from process variation, and to rank candidate causes by how much of the outcome each actually explains. That analysis is what tells you which experiments are worth running next — and it is far cheaper than designing a study before knowing where the variability sits. Where historical data cannot settle a question, saying so early is part of the deliverable.
Federal regulatory methodology through prime contractors — detection limits, survey design, guard bands and measurement uncertainty for NRC and EPA. Clinical trial biostatistics, including trial statistician roles on vaccine INDs with SAP authorship and FDA Information Request responses. Medical device validation covering test-retest reliability, inter-method agreement and normative ranges. Veterinary biologics efficacy, assay validation and safety. And industrial process capability, measurement system analysis and root cause investigation.
Study statistician on eight industry oncology, CNS and pharmacodynamic trials spanning Phase 1 through Phase 3 for a clinical data services firm, plus Phase 1 and Phase 2 vaccine trials and outcomes studies for a hospital research institute, and six medical device validation and reliability studies for a cognitive assessment manufacturer.
Yes, and it is a recurring deliverable. In one preclinical challenge study the lethal dose model converged and returned an estimate, but mortality ran flat across all five dose groups, the slope was barely identifiable, confidence limits could not be computed, and the point estimate fell orders of magnitude below the lowest dose administered. The deliverable was that the design could not answer the question and that the remedy was dose placement rather than a different model.